Tutorial
This tutorial guides you through how to use V•I•S•A to explore a multi-criteria decision situation.
This tutorial is based on the CARS EXAMPLE that is provided with V•I•S•A.
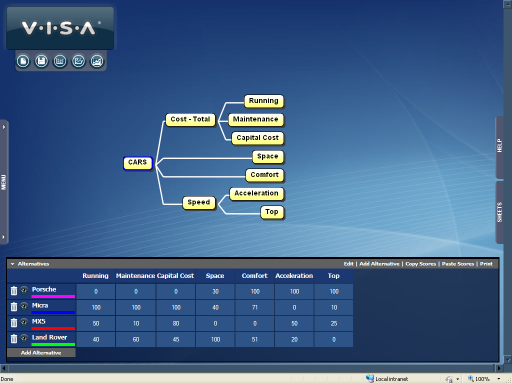
The screen shows the Value Tree (a hierarchy of criteria) and the Alternatives Window. Four alternatives are being evaluated; a Porsche, Land Rover, Micra and MX5. As you are probably aware, these are four very different types of car, but for various reasons they were all of interest to the decision maker, who we will call Joe!
Open this model by starting V•I•S•A and using the MENU Panel to Open the file CAR_CHOICE. Find this file in My Documents\V.I.S.A\Examples
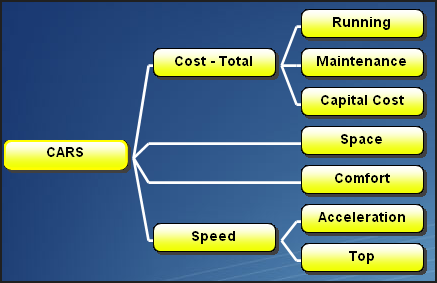
The Value Tree (criteria hierarchy) developed by Joe is as shown below.
Scores reflecting the performance of the four cars on each of the bottom-level criteria and weights reflecting Joe's current view on the importance of the criteria have already been entered in the model. We will begin by having a quick look at some of this data.
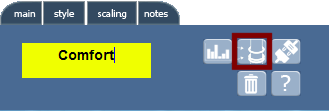
Start by having a look at how Joe has rated the cars on Comfort. Position the cursor over the criterion Comfort and hold the SHIFT key and CLICK to display the dialog box shown below.
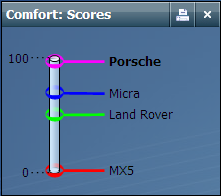
Click on the THERMOMETER button to display the chart below.
The Porsche is preferred with a score of 100 and the MX5 is considered to be least comfortable with a score of 0. Joe has used local scales for all the criteria - meaning that the most preferred of the alternatives considered always receives a score of 100 and the least preferred a score of 0 (this is discussed in more detail in section on Scaling). If you disagree with Joe's scoring it is easy to make changes - position the cursor on the alternative whose score you want to change and DRAG it to the desired position.
Let us look now at how Joe has scored and weighted the sub-criteria of Total Cost. Before moving on it is always a good idea to close down any windows you have finished with, otherwise the screen will become cluttered. CLICK on the close icon (always in the top right corner of any window) to close the window displaying the scores on Comfort.
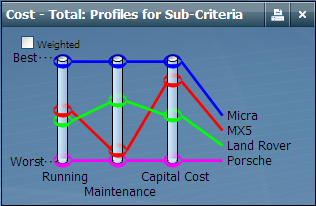
Rather than looking individually at the scores on each of the sub-criteria of Total Cost we can display a chart which shows the profile of each of the alternatives across all criteria in the family. To do this hold down SHIFT and CLICK on Total Cost to display its dialog box and then CLICK on the Profiles button  to display the chart. From this we can see that the Micra is a dominating alternative, being preferred on all sub-criteria. On the other hand, the Porsche is dominated by all the other alternatives, being the least preferred on all criteria.
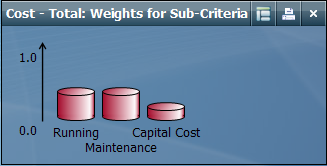
It would be interesting to know how Joe has weighted the sub-criteria of Total Cost. To see hold down SHIFT and CLICK on Total Cost to display the dialog box and this time CLICK on the Weights button  to display a bar chart of weights assigned to the sub-criteria. It seems that Joe is more concerned about recurring costs - Maintenance and Running costs than the initial capital expenditure.
To see how this information is synthesized to give an aggregate score for Total Cost, hold down SHIFT and CLICK on Total Cost to display the dialog box for a third time and CLICK on the Score Chart button  to display the bar chart of scores for alternatives.
As we would expect, since the Micra scores 100 on all sub-criteria its aggregate value on the Total Cost criterion is 100. Similarly, the aggregate value for the Porsche is zero. The situation with respect to the MX5 and the Land Rover is less clear cut - if we were to change the weights allocated to criteria the aggregate values would change. Let us investigate what would happen if Capital Cost were to become more significant. In the Weights window position the mouse cursor at the top of the bar showing the weight given to Capital Cost and DRAG the weight to a higher value. As you do so, observe how the values in the Total Cost: Scores window change - as the weight on Capital Cost is increased, the Total Cost score of the MX5 increases, whilst that of the Land Rover decreases.
We could look similarly at the aggregation of Acceleration and Top to give an aggregate score for Speed. However, let us move on to look at the overall evaluation of the alternatives. Before proceeding it would be a good idea to close the windows currently on the screen (CLICK on the close button at the top right of each window)
Following the same steps as above display windows showing the overall scores of alternatives, the weights assigned to the sub-criteria of CARS (i.e. at the top level of the hierarchy) and the profile of scores for the alternatives (to do this SHIFT CLICK on CARS to display the dialog box then CLICK on the Scores Chart, Weights and Profiles buttons in turn).

