Thermometer Charts
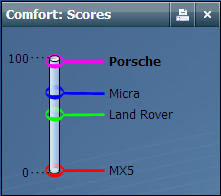
These Charts provide a clear visual representation in terms of ranking and ‘distance’ between the alternatives.
In the case of bottom level criteria the hoops (or the names) an be dragged to set new scores. Other open charts are dynamically updated to reflected the resulting scores throughout the Value Tree.
Each alternative shown in the color set for that alternative in the Alternatives Window.
See also:

